The Wheel strategy, step by step — and how to actually track it
The wheel is the most popular way retail investors earn income from options: get paid while you wait to buy a stock, get paid again while you hold it. Here's how a full cycle works, the numbers that tell you whether it's working, and where trackers usually fall apart.
The idea in one paragraph
Pick a stock you'd be happy to own at a lower price. Sell someone the right to make you buy it there (a cash-secured put) and collect a premium for the promise. If the stock stays up, the promise expires and you keep the premium — do it again. If it falls, you buy the shares at your chosen price (you're assigned) — and then sell someone the right to take those shares off you at a higher price (a covered call), collecting premiums again until they're called away. Buy low, sell high, and get paid at every step in between. That loop is the wheel.
1Sell a cash-secured put
Choose the price you'd genuinely pay for the stock. Sell a put at that strike and set aside the cash to honour it (strike × 100 per contract — your collateral). The premium lands immediately and is yours no matter what happens.
2Expire — or get assigned
If the stock holds above your strike, the put expires worthless: keep the $900, your cash is freed, sell another put. If it closes below, you're assigned: you buy 100 shares at $400 — the price you already said you'd pay — and your real cost is lower ($391 here) because of the premium you kept.
3Sell covered calls on the shares
Now the shares pay you rent. Sell a call above your cost — you collect premium every cycle, and if it expires you sell another. Each premium lowers your effective cost further.
4Called away — the cycle completes
Eventually the stock closes above your call strike and the shares are sold at that price. Total return for the cycle = every premium collected + the gain from your assignment price to the call strike. The wheel is now back at step 1 with more cash than it started with — and one honest question: what did the whole loop earn on the money it tied up?
The numbers that actually tell you something
| Metric | What it means in plain terms |
|---|---|
| ROI on collateral | Premiums kept ÷ cash the position tied up. The wheel's real report card — $900/month feels great until you notice it's parked $40,000. |
| Annualised ROI | That ROI scaled to a year (× 365 ÷ days actually elapsed) so a 23-day trade and a 45-day trade can be compared honestly. |
| Cycle P/L | All premiums plus the share gain, across every leg and roll of one full put→assigned→called-away loop — not per-trade fragments. |
| Effective cost basis | What the shares really cost you after every premium collected. This is the number that decides whether an assignment was a loss or a discount. |
| Safety distance | How far the stock sits from your short strike right now — the early-warning number for the next assignment or call-away. |
Where tracking falls apart — and what to do about it
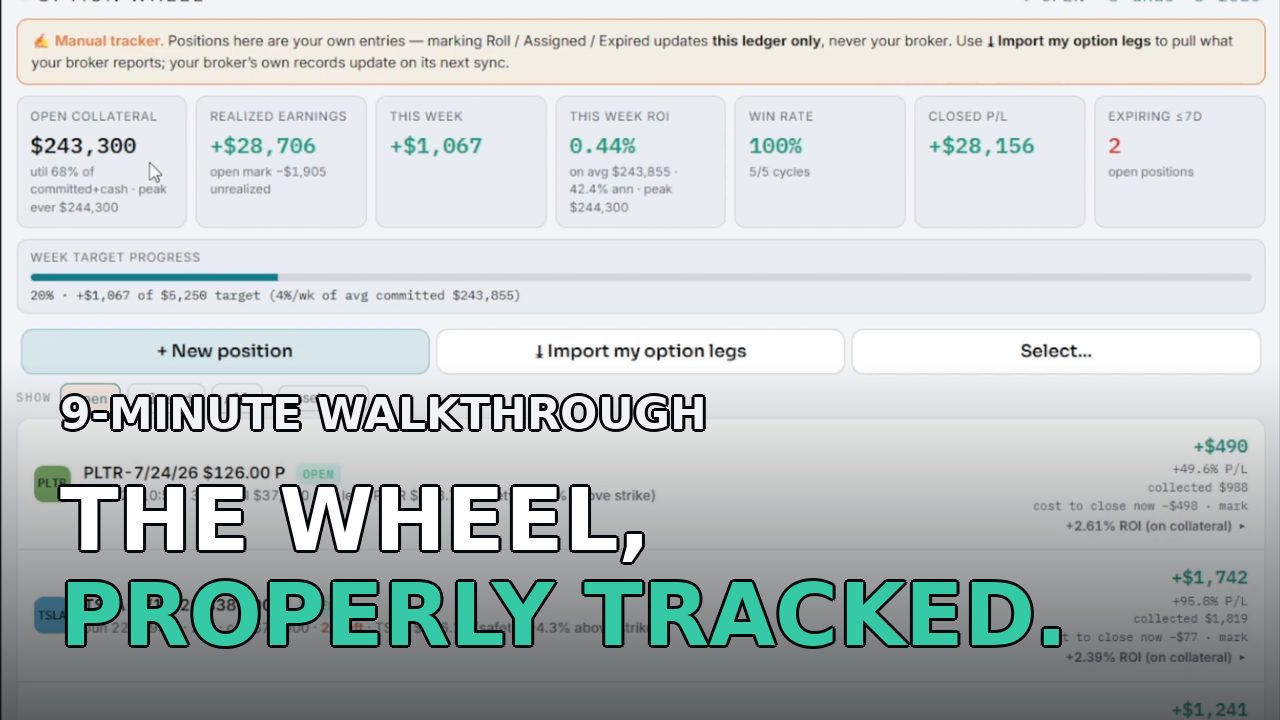
Run the wheel for three months and your broker statement is a wall of disconnected rows: puts sold, puts assigned, shares in, calls sold, calls rolled, shares out. No single line tells you what a cycle earned on the money it committed. Spreadsheets work until the first roll or partial assignment, then quietly go wrong.
Run your wheel. Let the engine keep score.
Track cash-secured puts and covered calls position by position — cycles, rolls, collateral and lifetime ROI, computed for you. Free to start, no card.
Open RiskGlasssee the daily report it feeds →